What’s new with Kt-Pulse?
The Kt-Pulse Continuous Improvement Journey
Kt-Pulse is a platform for improving manufacturing productivity. Our unique approach is to make it really easy to capture data, through the eyes of the production operators, from any manual or semi-automated manufacturing process. Our vision is a manufacturing environment where you will have access to all of your manufacturing data in one click, allowing you to make better decisions and ultimately improve manufacturing productivity.
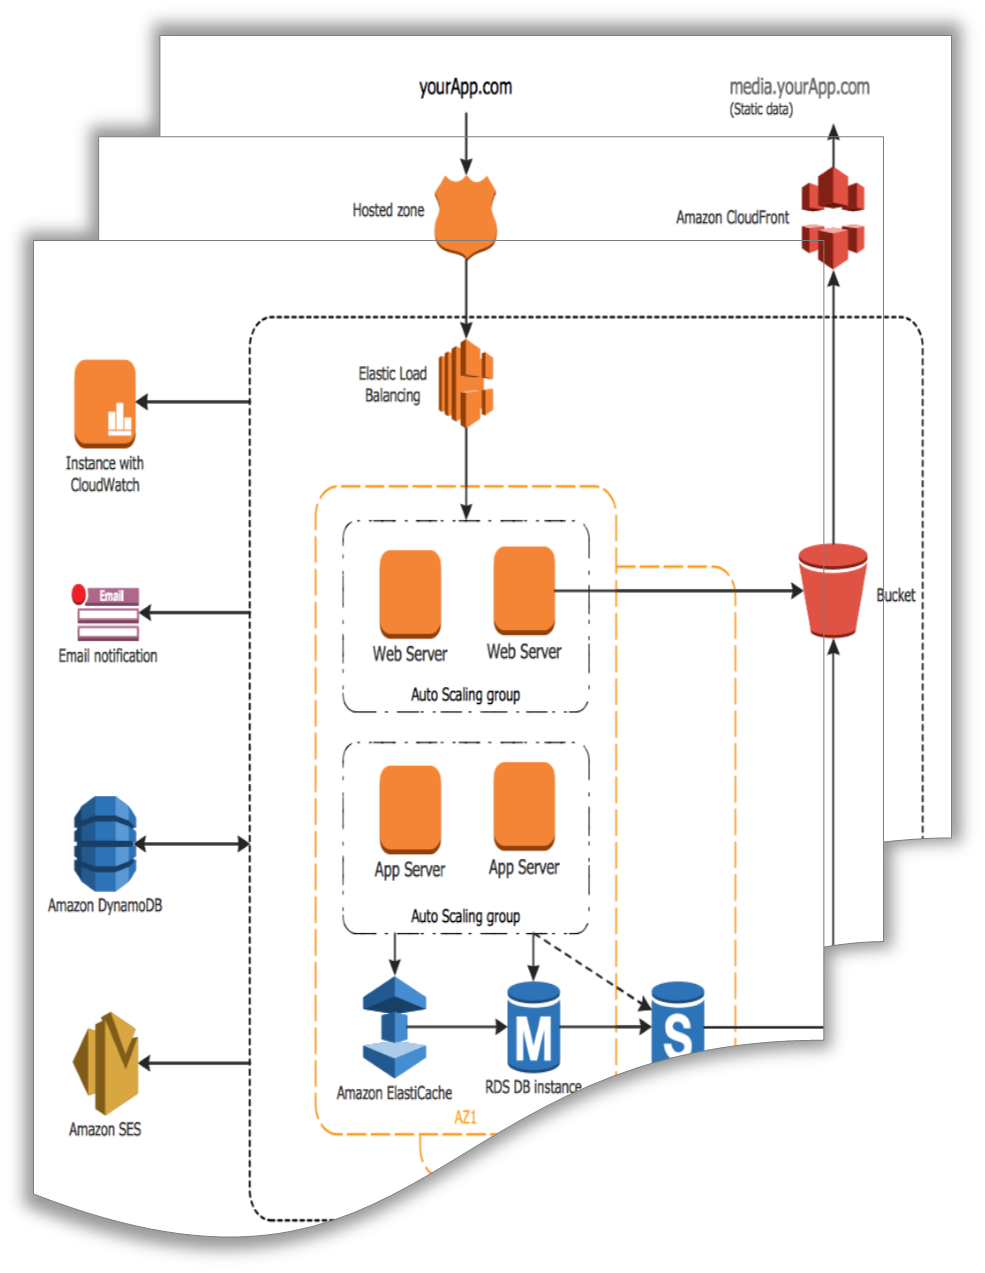
Version 2.0 was re-built from the ground up using the latest AWS technology suite. It provides significant improvements in user experience, performance and analytical insights as well as providing much more autonomy to customers on how they use Kt-Pulse to run their operations.
Our philosophy is to continually improve Kt-Pulse based on customer feedback and to make all upgrades available to our customers automatically. That way everybody gets the maximum benefit from all Kt-Pulse has to offer. Check out what’s new below
Version 2.2 New Features
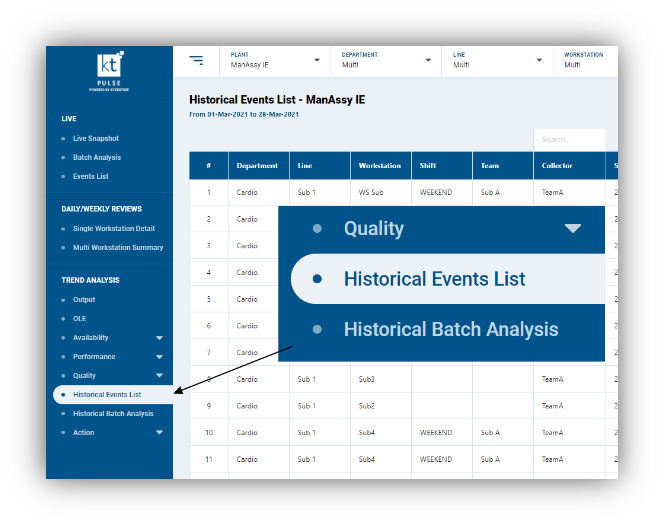
Historical Events List
The Historical Events List displays every event that is logged on each data collector in time order sequence. All events are timestamped allowing the user to diagnose what is occurring at a very granular level.
Searches can be carried out by plant, department, line, workstation, shift, date, batch number, part number or event type. The data is easily downloadable to csv file for further analysis
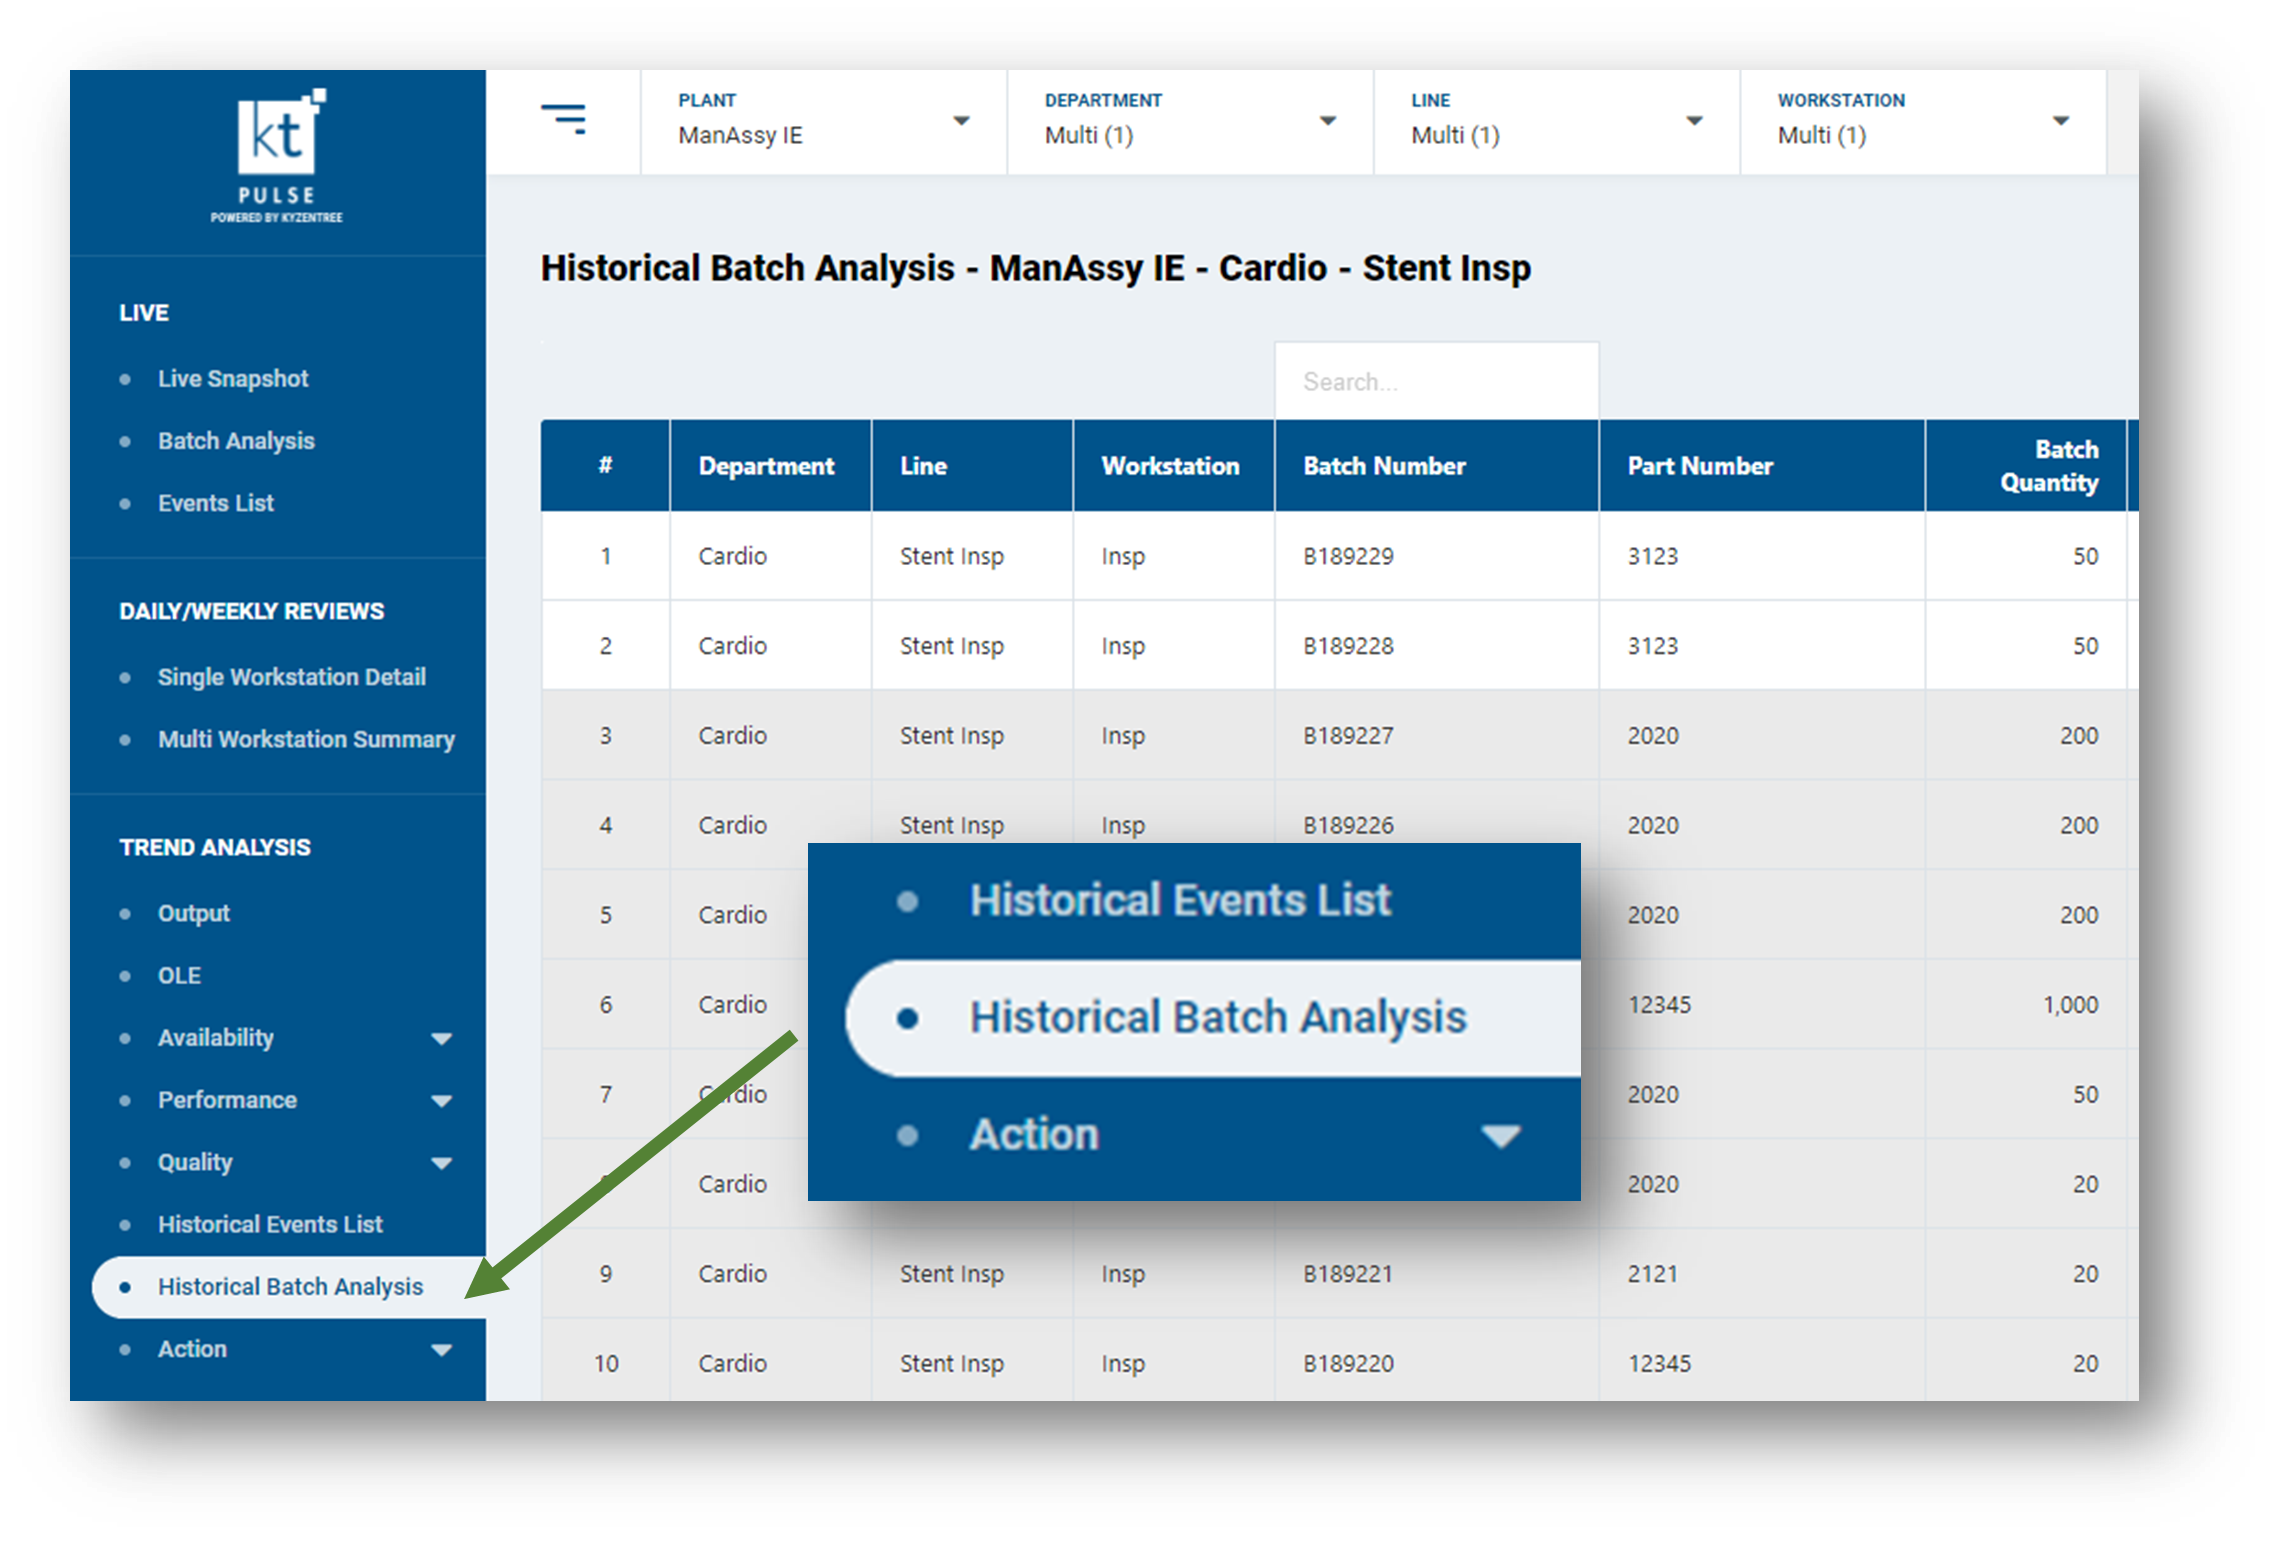
Historical Batch Analysis view
The Historical Batch Analysis table displays all of the batches of product that have been manufactured through each workstation. This enables the user to access a real-time status of every batch so that they can accurately predict when the batch will be completed. It also gives historical data on how long each batch took to manufacture, giving a much more accurate indication of lead time.
Searches can be carried out by plant, department, line, workstation, shift, key dates and batch number. The data is easily downloadable to csv file for further analysis
Bulk uploading of part numbers
Part numbers can be now be bulk uploaded into the Kt-Pulse system. Simply save the part numbers in a CSV file using the defined headings, select import and follow the system instructions.
Hundreds or even thousands of part numbers uploaded in a matter of seconds.
Export data from all tables
The data from all tables in Kt-Pulse can now be exported to Excel via CSV for further analysis, giving users the flexibility to carry out deeper analysis in a way that suits their business needs.
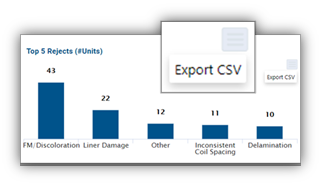
Export data from all charts
The data from all charts in Kt-Pulse can now be exported to Excel via CSV for further analysis, giving users the flexibility to view the data in different ways, based on the needs of the business.
Version 2.1 New Features
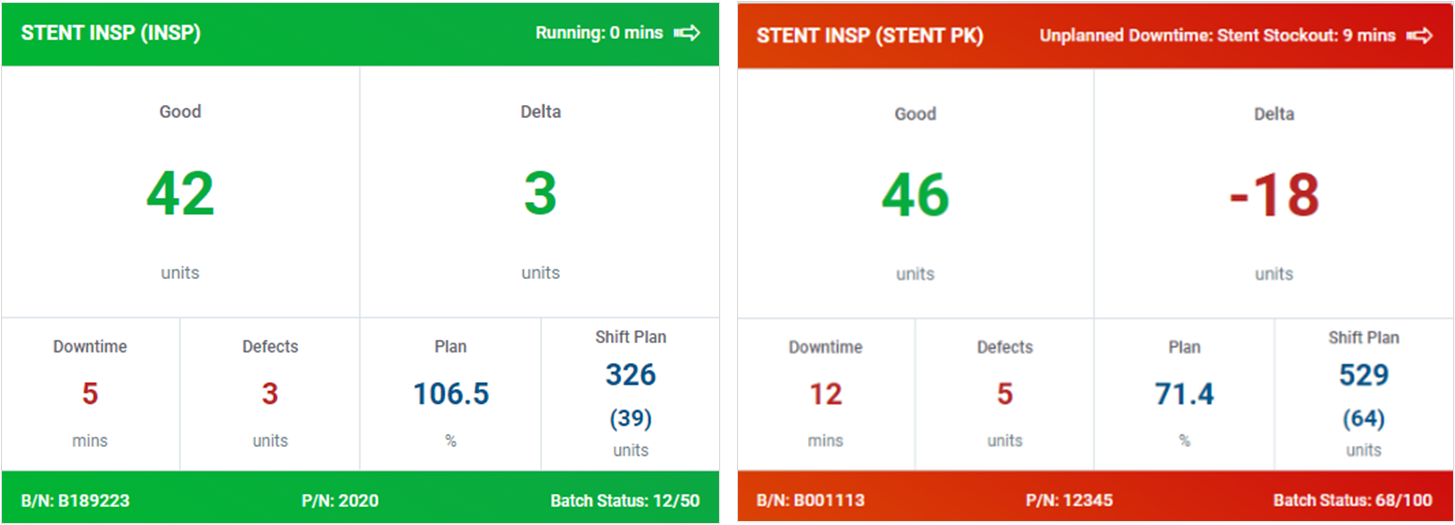
Live Tile view re-design
The Live Tile view has been re-designed to give you even greater clarity on how live shifts are performing at a glance.
The batch data has been moved to the bottom bar and the critical numbers have been increased in size to make them more visible when you are further away from the screen
Live Workstation Detail view
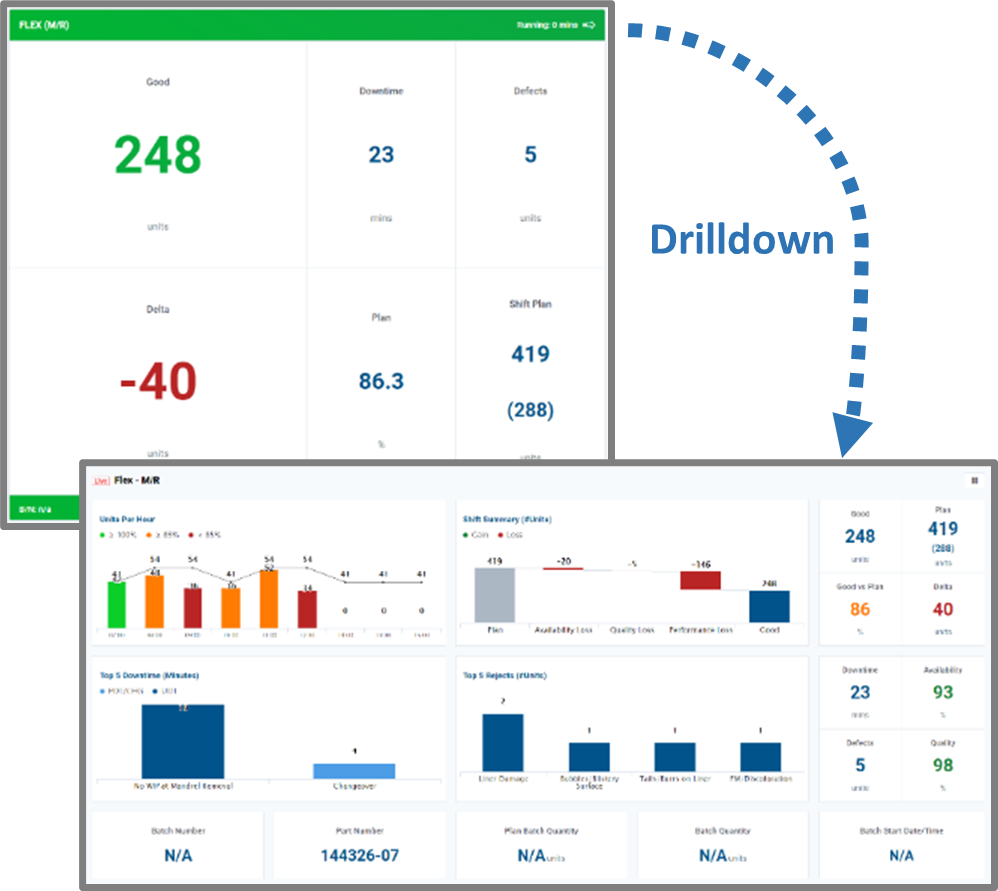
The Live Workstation Detail view is now available in a live format. You can leave the Live Workstation Detail view on display permanently and the chart will update automatically each time a new event is logged
Or you can drill down from the Live Tile view directly to the Workstation Detail view to instantly see a deeper analysis of how your workstations are performing in real-time.
This works great if you need to see output on an hourly basis or if you want to dig deeper into downtime or scrap issues
Auto select downtime reason
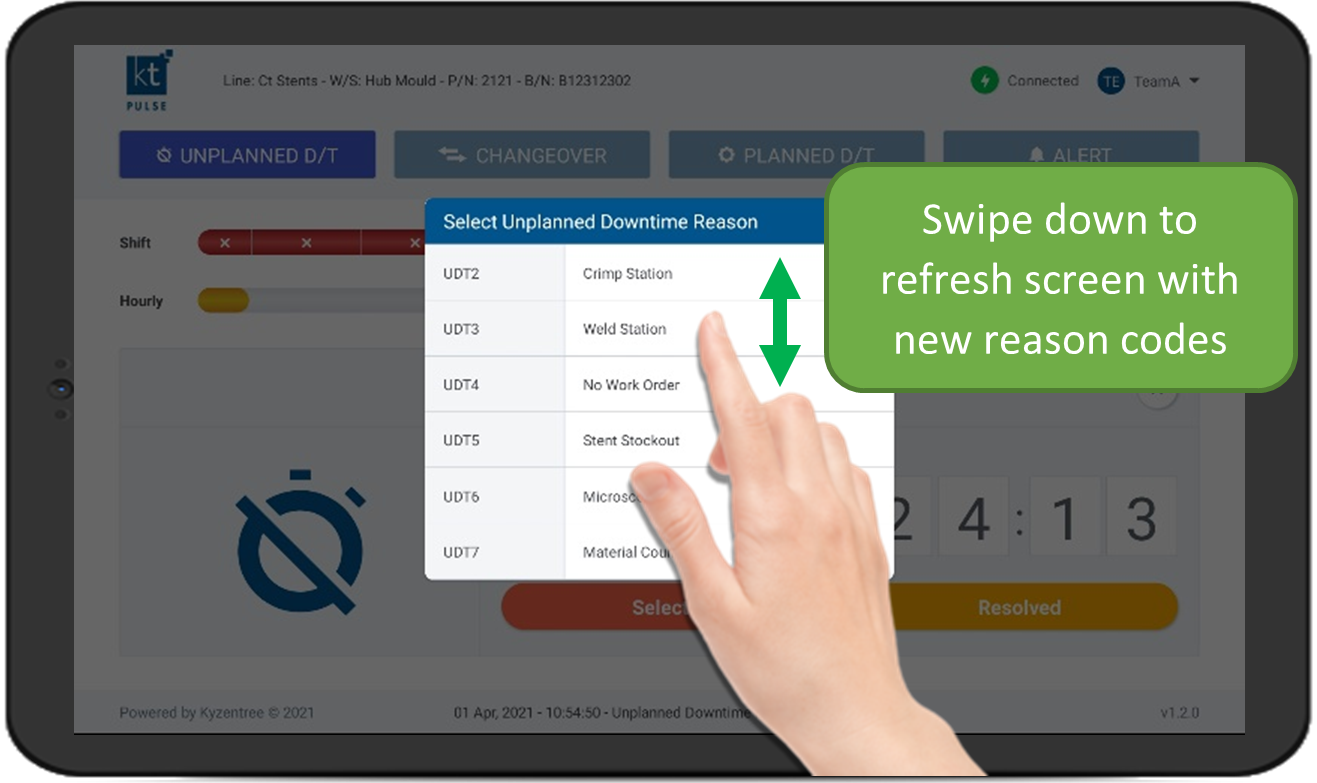
If you experience a new downtime or scrap issue on the manufacturing floor you can add it to the system and it will instantly appear in the dropdown menu of the relevant data collector without the need to log out and log back in
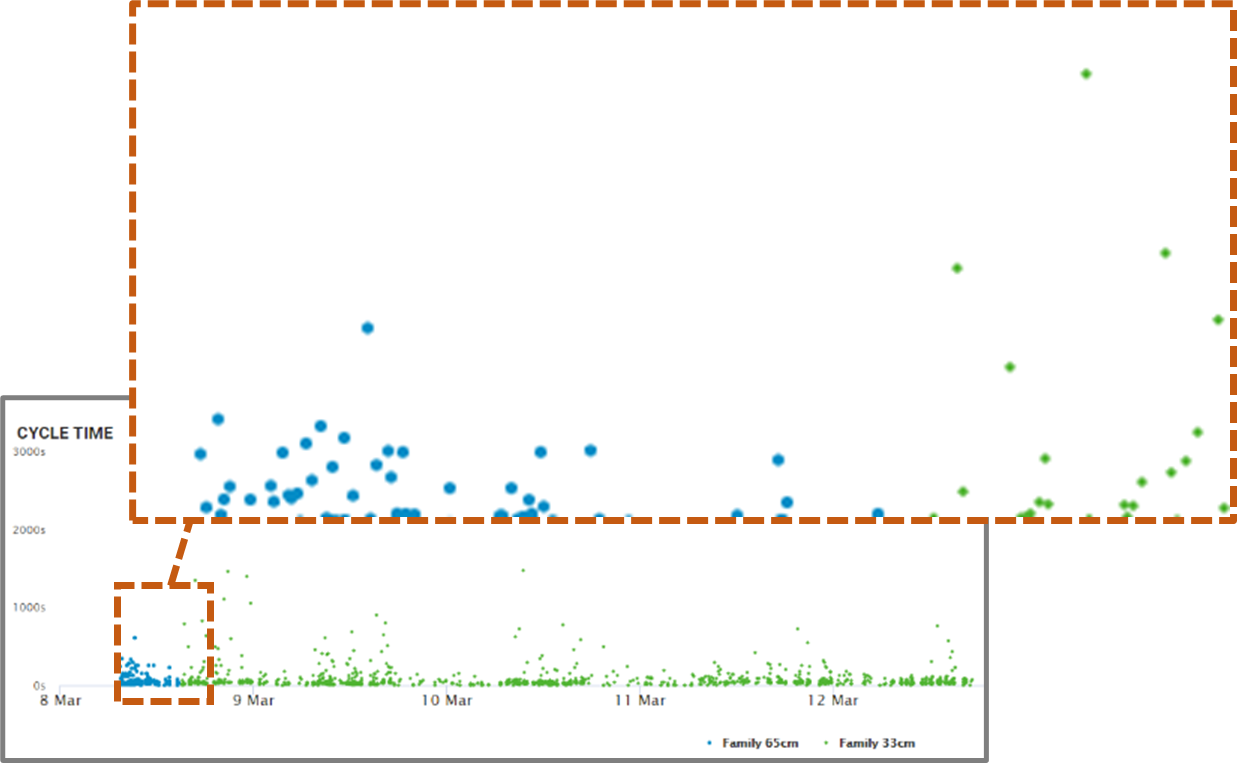
Zoom in on cycle time analytics
Zoom in on a specific time point or set of data for a better understanding of cycle time variation.
This works great if you have outlier values that are distorting the full picture of what’s happening.
Zoom out again to look at the macro picture in more detail
Version 2.0 New Features
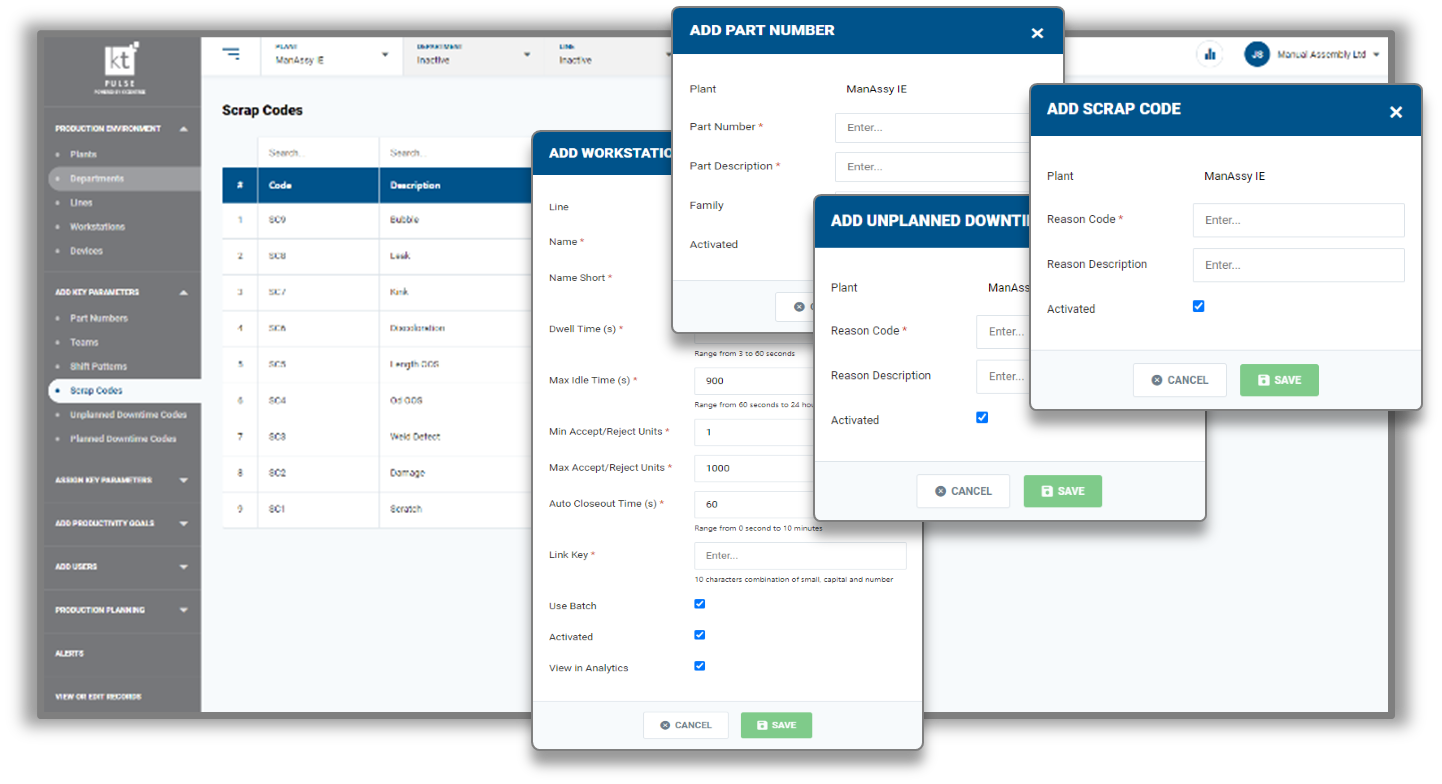
New SETUP frontend
Customers now have full control over how they set up their workstations in the Kt-Pulse system.
The frontend has been completely redesigned to allow customers to intuitively navigate their way through the entire setup process with a suite of accompanying training videos
Production scheduling
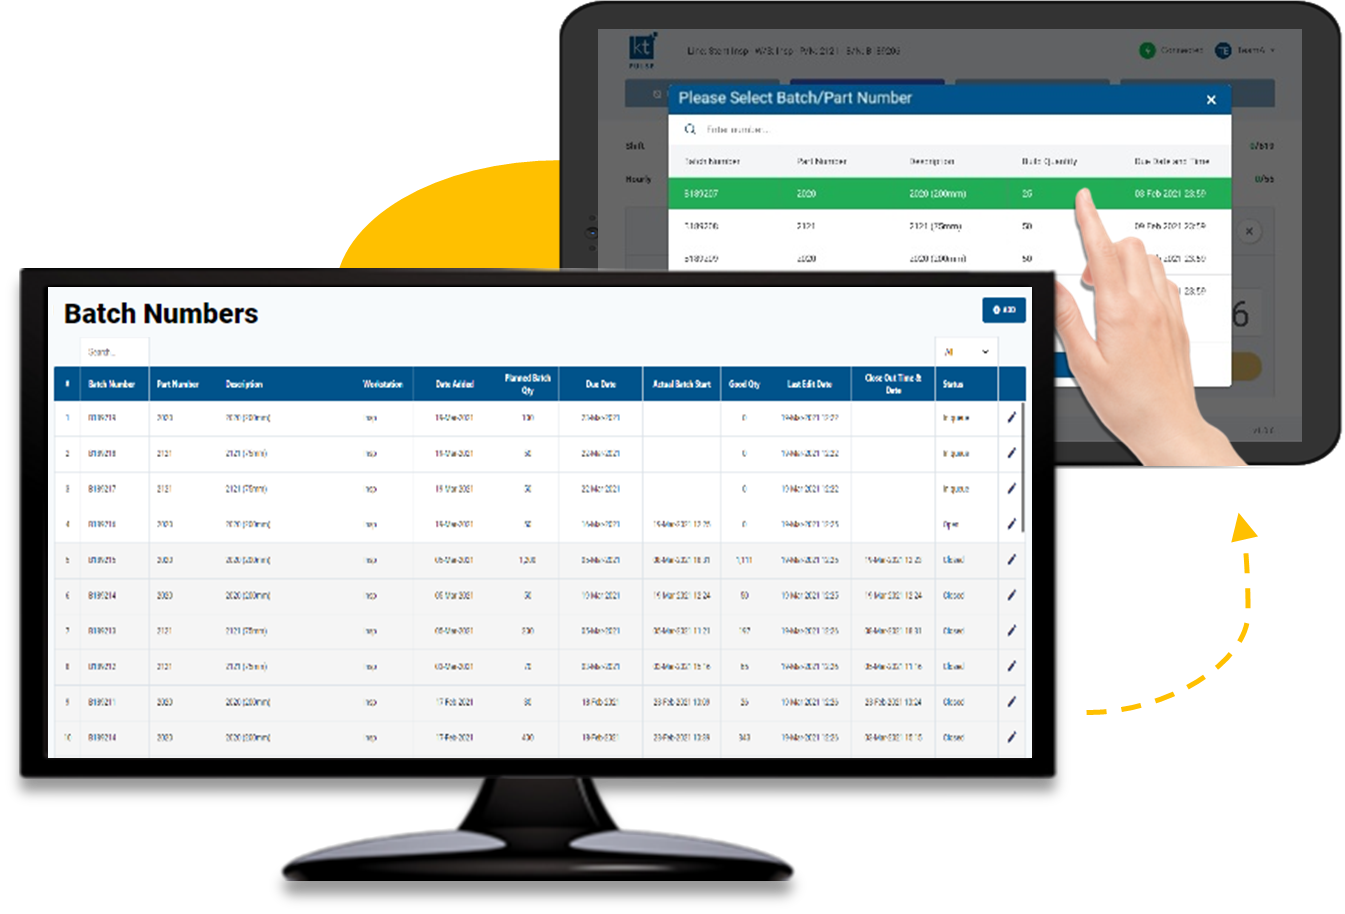
Customers can now plan their Customers can now plan their production schedule through Kt-Pulse:
- Easily control which batch the production operators must choose next during the Batch Changeover process.
- Real-time visibility on start and finish times of each batch as well as live output and defect numbers
- Accurately predict when batches will be ready to ship This gives your production and supply chain teams a powerful tool to plan shipments with more precision
New analytics frontend
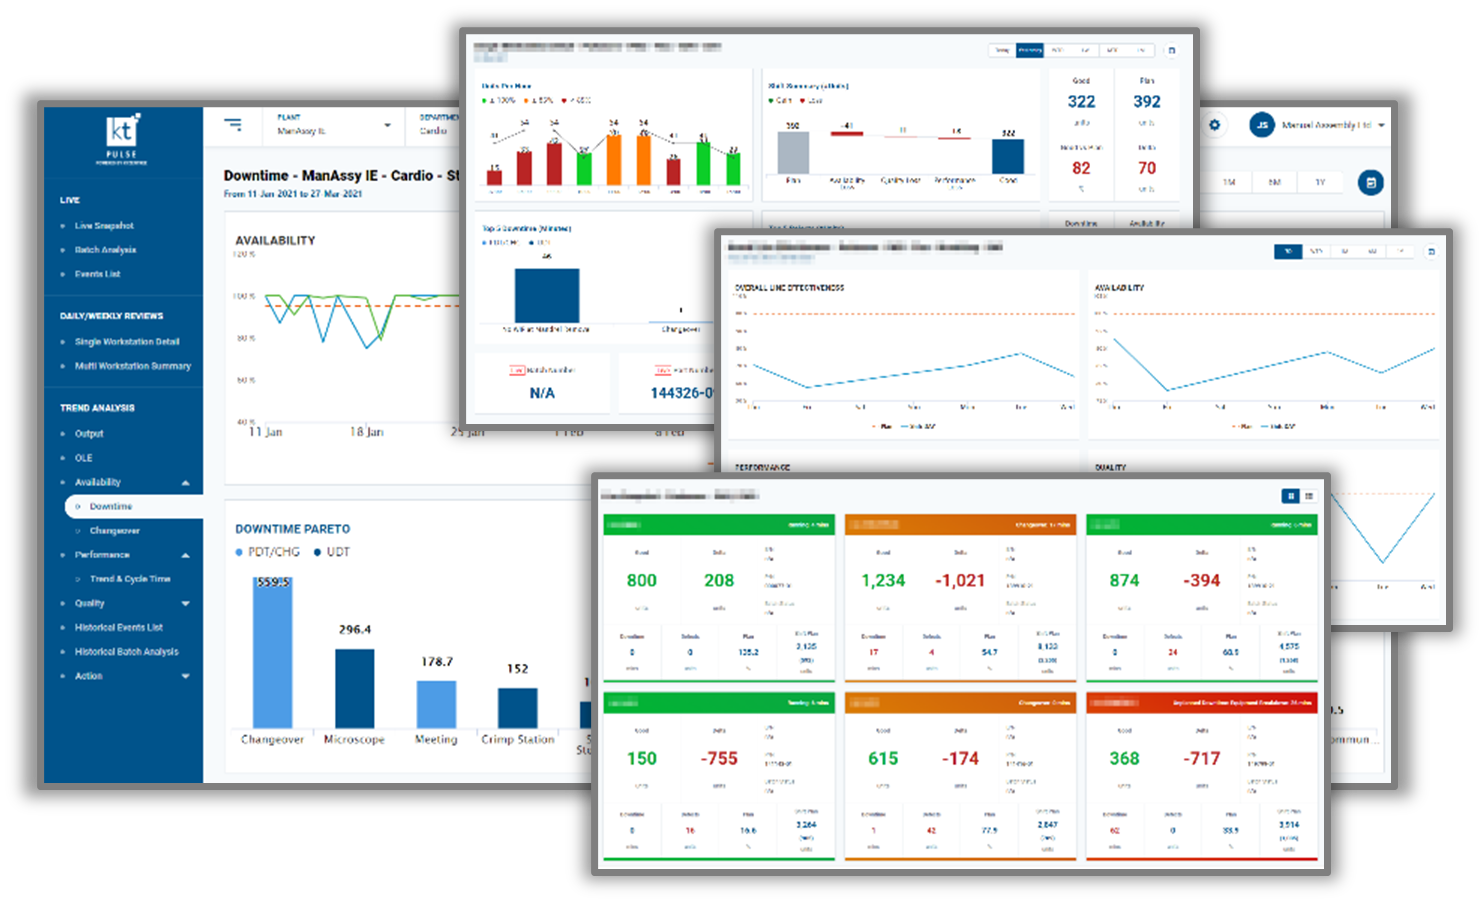
The analytics frontend has been completely re-designed to make it much easier to navigate between analytical views.
The analytical left menu bar enables you to select whatever data view you wish and the advanced filters enable you to analyse the data by plant, department, line, workstation, shift and team for whatever time period you wish.
Drilldown functionality has also been introduced, which means you can easily navigate between data views during team meetings.
Backend performance
The backend has been re-designed and built from the ground up to cater to the demands of generating real-time analytics across a range of key performance indicators.
Many of AWS’s latest tools have been used to ensure that customers securely and seamlessly navigate the analytics in real-time, creating an engaging and interactive user experience
Comparison of version 1.0 and 2.0
Navigation | Kt-Pulse version 1 | Kt-Pulse version 2 |
Full workstation setup frontend | - | Yes |
Users setup management | - | Yes |
Setup menu bar | - | Yes |
Analytics menu bar | - | Yes |
Drilldown functionality | - | Yes |
Full screen mode | Yes | Yes |
Quick date range selection | - | Yes |
Data Visualisation | Kt-Pulse version 1 | Kt-Pulse version 2 |
Real-time analytics | Yes | Yes |
Historical data | Yes | Yes |
Live tile view | - | Yes |
Live detailed workstation view | Yes | Yes |
Shift summary dashboards | Yes | Yes |
Long term trend charts | Yes | Yes |
Production planning dashboard | - | Yes |
Events log | Yes | Yes |
Technology | KT-Pulse version 2 | Kt-Pulse version 2 |
Cloud-based Analytics | Yes | Yes |
Android app (data collector) | Yes | Yes |
iOS app (data collector) | Yes | Yes |
Metrics | Kt-Pulse version 1 | Kt-Pulse version 2 |
Live Output counts | Yes | Yes |
Hourly Output counts | Yes | Yes |
Live Output Plan | Yes | Yes |
Live Shift Plan | Yes | Yes |
Defects (count) | Yes | Yes |
Unplanned downtime (minutes) | Yes | Yes |
Planned downtime (minutes) | Yes | Yes |
Downtime (lost units potential) | Yes | Yes |
Changeovers (minutes) | Yes | Yes |
Batch counts and status | - | Yes |
OLE (Overall Line Effectiveness) % | Yes | Yes |
Availability (%) | Yes | Yes |
Performance (%) | Yes | Yes |
Quality (%) | Yes | Yes |
Unplanned downtime during changeovers (mins) | - | Yes |
Cycle Times (seconds) | Yes | Yes |
Timestamps of all events logged | Yes | Yes |
Filters | Kt-Pulse version 1 | Kt-Pulse version 2 |
Plant | - | Yes |
Department | - | Yes |
Line | Yes | Yes |
Workstation | Yes | Yes |
Shift | Yes | Yes |
Team | - | Yes |
Date | Yes | Yes |
