How it works
Step 1
Set Up
Choose which processes to monitor
Kt-Pulse works seamlessly with any manual or semi-automated process. Monitor your critical assembly, inspection and packaging processes to unlock their true potential


Input manufacturing parameters
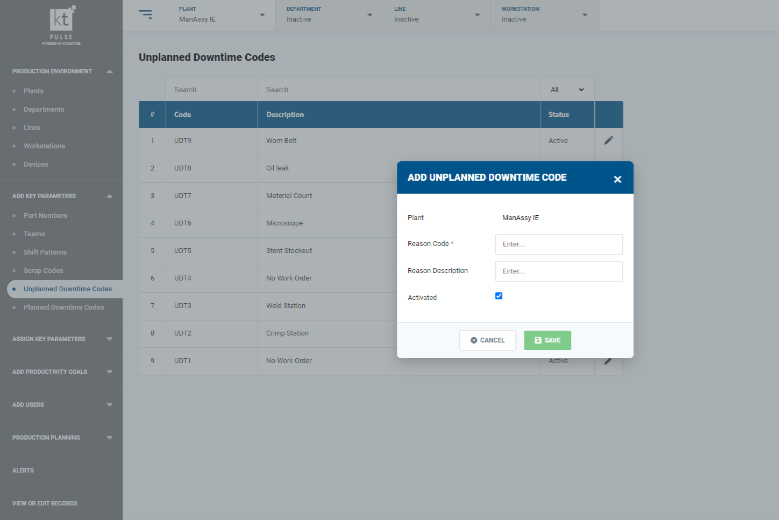
Upload the information for the critical processes into the Kt-Pulse System, such as shift patterns, hourly targets, scrap codes and downtime codes
Set up data collectors
Download the Kt-Pulse collector app onto any Android or iOS tablet and link it to the Kt-pulse system. Locate the tablets right where the operators are working. The app runs on BlueStacks also

Set up analytics monitors
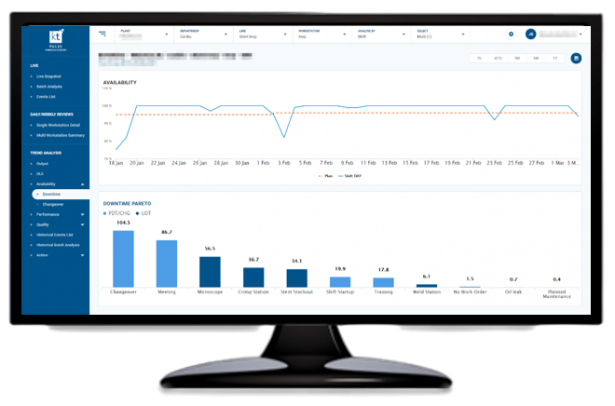
The analytics run on web browsers like google chrome. Display the monitors in convenient locations for the operators and interactive team meetings

Step 2
Capture
Production operators log events in real-time throughout their shift. Quick button presses, no calculations, no retrospective guesswork
Good Units
Log good units one at a time or multiple units at a time, whatever suits you
Reject Units
Log scrap units one or more at a time, along with reason codes and discover the time-based trends in defect levels
Downtime
Capture planned and unplanned downtime events with unparalleled accuracy, from short disruptions through to full shutdowns
Changeovers
Easily prioritise what to build next and capture precisely how long changeovers take
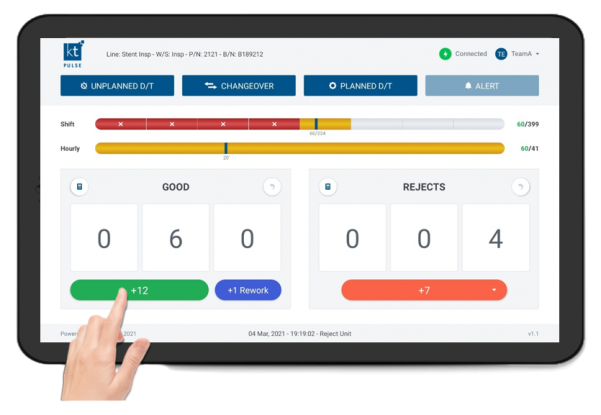
Log good units
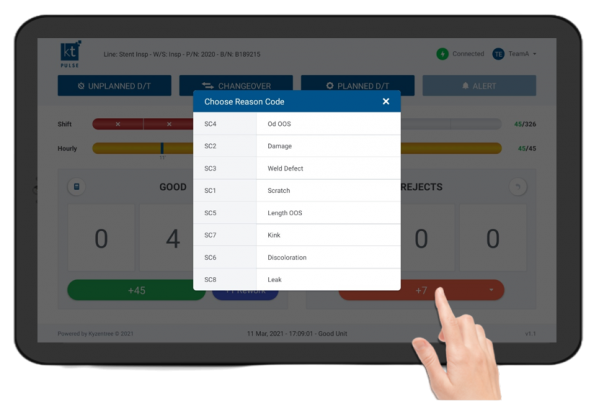
Log reject units
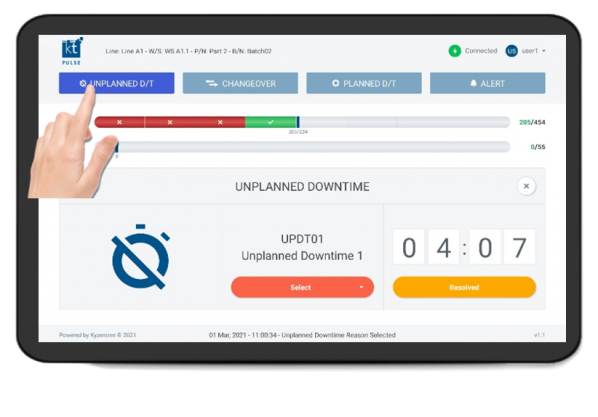
Log downtimes
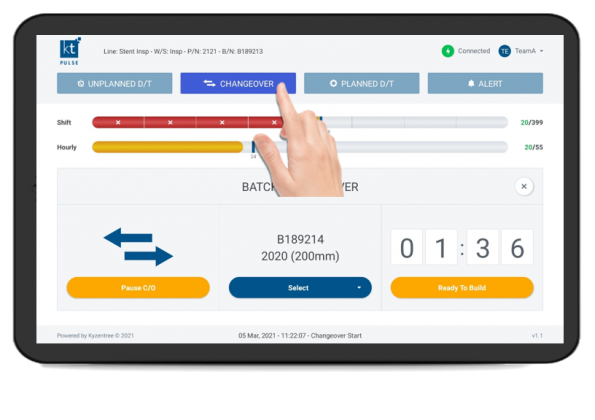
Log changeover events
Step 3
Visualise
Kt-Pulse provides you with a single source of all of your production data. Accurate, real-time dashboards in an engaging, interactive way
Drive improvement at every level
Improvement comes in many ways. At a daily level, it’s about addressing problems quickly when they arise. On a weekly level, it’s about prioritising what can get done in the next few days to maximise productivity. On a monthly or quarterly level, it’s about picking the right projects to make step improvements in performance. We have designed Kt-Pulse with all levels in mind
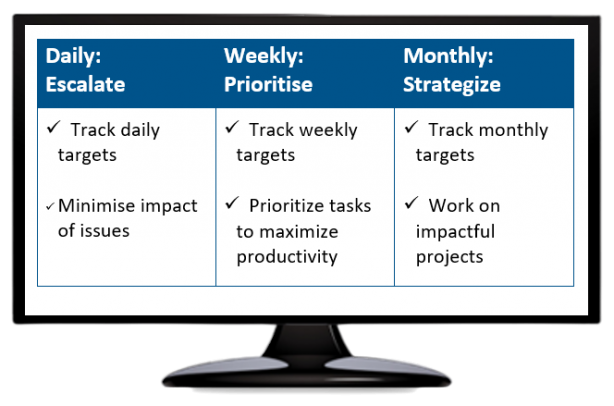
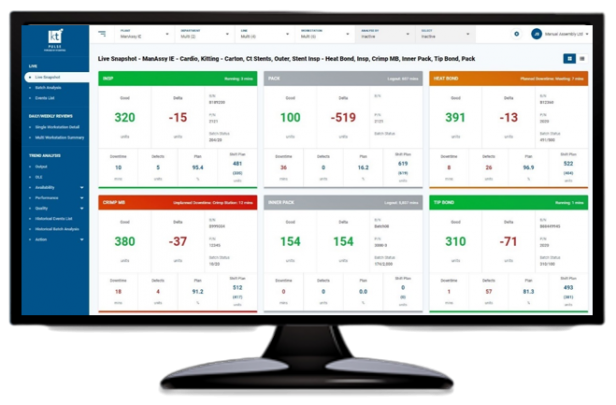
Live Dashboards
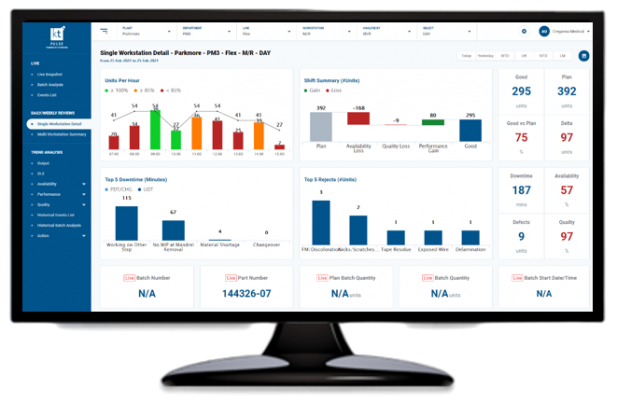
To have a successful shift, production teams need to know what to make, are they on track and what the priority issues are. The live snapshot view gives you all this at a glance
Daily/Weekly Reviews
To have effective and engaging meetings, you must have good data. If your data is inaccurate or out of date, you cannot make good decisions. Our summary dashboards give you an accurate overview of your key metrics by shift, day, week and month
Trend Analysis
To drive effective improvement, you must know where you are losing time and materials. Our charts and event tables will give you the precise data you need to make measurable improvements
